3. Live Monitoring
Read raw and filtered waveforms, inspect the frequency spectrum, watch band power trends, and use the brain heatmap.
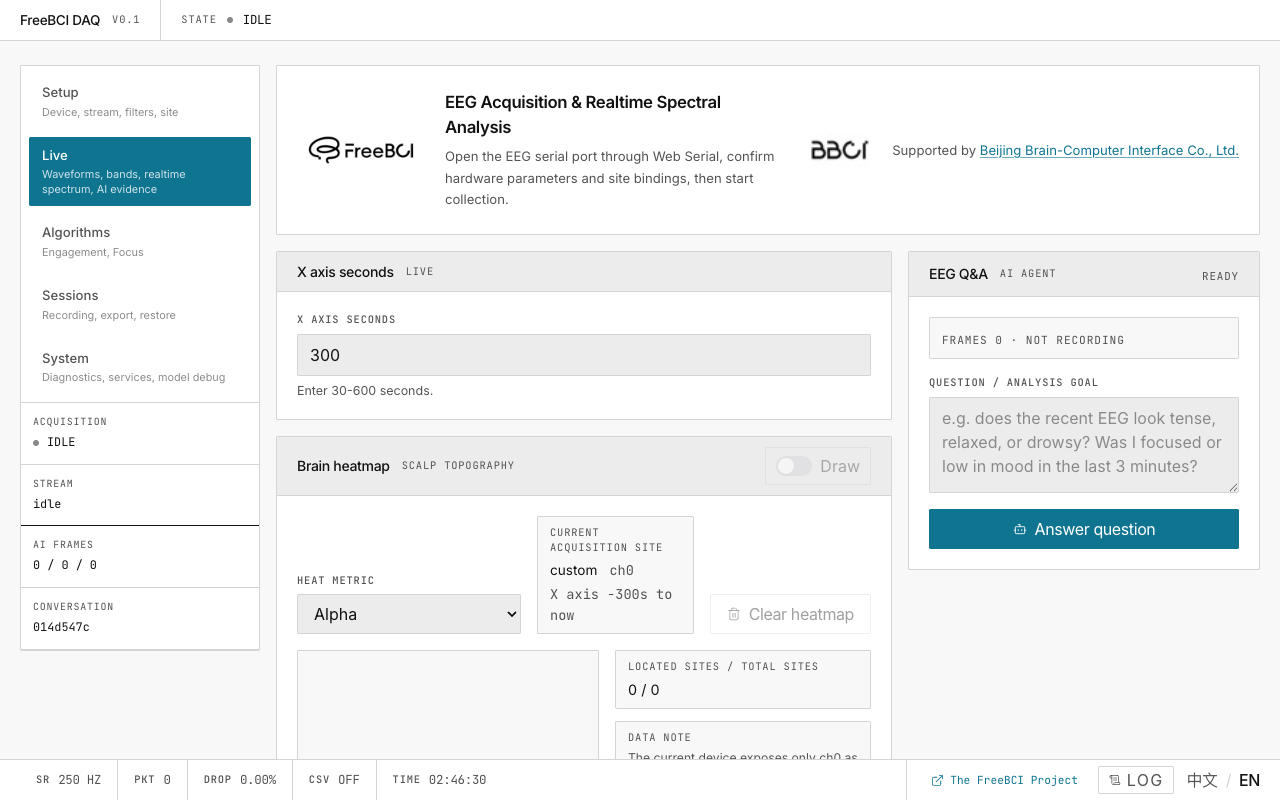
The Live page is a two-column dashboard: waveforms and charts on the left, AI analysis sidebar on the right.
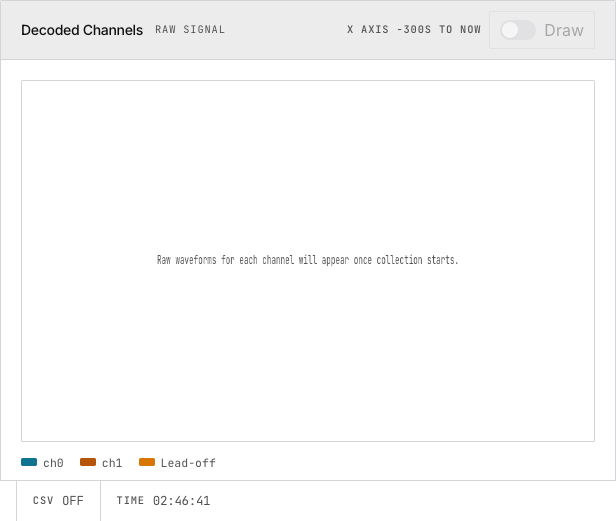
Waveform Panels
| Panel | Data Source | Use For |
|---|---|---|
| Raw Signal | Direct from serial parser | Checking signal quality |
| Filtered Signal | After 4th-order Butterworth IIR | Clean signal for analysis |
Controls: Y-axis range, channel selection, lead-off markers, tooltip on click/hover. Both panels use requestAnimationFrame → Canvas rendering for 60 fps.
Spectrum Compare
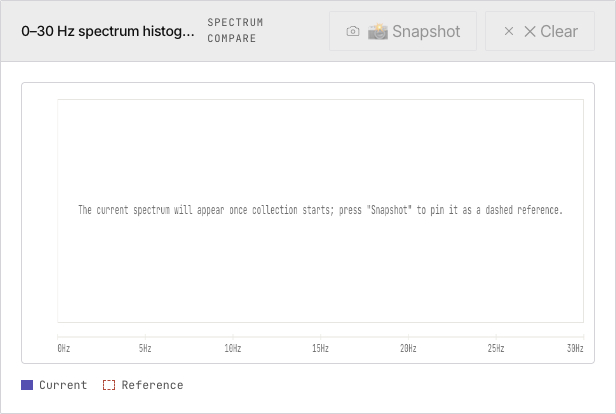
0–30 Hz FFT magnitude as a bar histogram. Press Snapshot to pin the current spectrum as a dashed reference. Useful for comparing baseline vs. task states.
Brain Heatmap
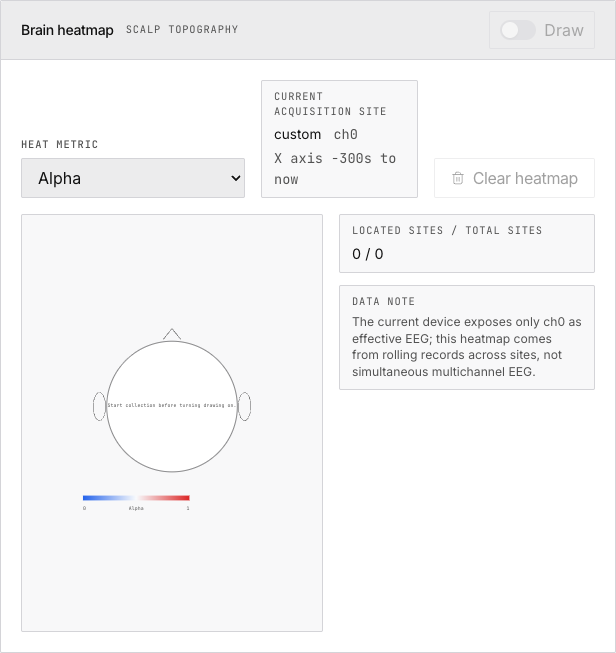
Scalp topography showing band power intensity at electrode positions. Switch the heat metric between Delta/Theta/Alpha/Beta/Gamma/EI. Builds up over time via rotating through acquisition sites (single-channel limitation).
Five-Band Feature Trend
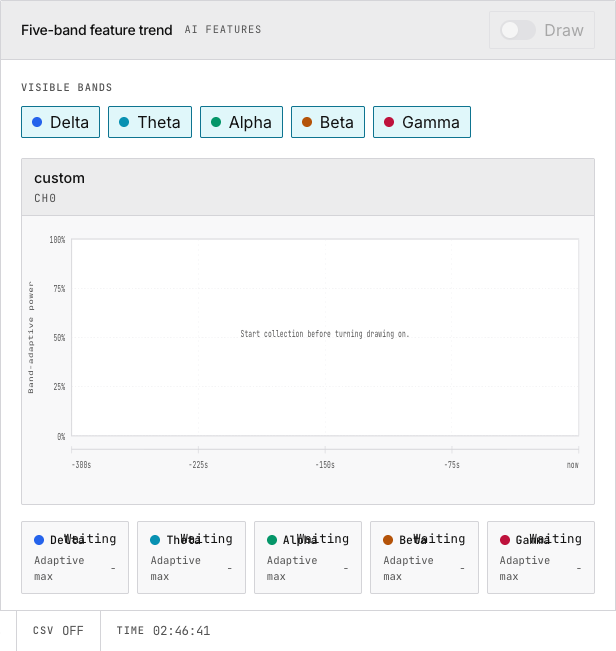
Time-series plots of delta, theta, alpha, beta, gamma band power. Each line is adaptively normalized per band within the X-axis window. Toggle individual bands on/off. These vectors feed the AI analysis pipeline.
AI Analysis Sidebar
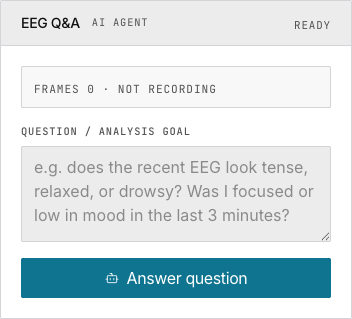
Configure an OpenAI-compatible LLM, ask questions about your EEG data. Requires five-band feature recording to be enabled on the Setup page.
Bottom Status Bar
SR 250 | PKT count | DROP count | CSV state | TIME elapsed | Log diagnostics | EN language toggle
Next
→ Track Engagement Index and calibrate focus detection → Ask an AI to interpret your EEG